Credit Application Prediction: Data Preprocessing & SVM Classification
Project Overview
This project demonstrates a comprehensive data science workflow, from data preprocessing to advanced modeling techniques. It focuses on fundamental data science tasks including preprocessing, normalization, binning, smoothing, dimensionality reduction with Principal Component Analysis (PCA), and applying Support Vector Machines (SVM) for classification. The analysis showcases how proper data preparation and feature engineering can significantly improve model performance and interpretability.
Methodology
The project follows a structured approach to data analysis and modeling:
- Data loading, inspection, and visualization
- Variable normalization using Z-score, Min-Max, and Decimal Scaling
- Equal-depth binning of numerical variables
- Bin mean smoothing to reduce noise
- SVM classification with cross-validation
- Hyperparameter tuning via grid search
- Categorical variable transformation using dummy encoding
- Dimensionality reduction with PCA
- Model evaluation and comparison
Each step was carefully implemented in R, with appropriate visualization and validation to ensure the quality of the analysis.
Key Findings
- Normalization techniques successfully rescaled variables while preserving their distribution patterns
- Equal-depth binning created balanced categories for continuous variables
- SVM with 10-fold cross-validation achieved ~75.8% accuracy on the approval prediction task
- Optimal SVM cost parameter (C=0.1) improved accuracy to ~76%
- Dummy variable encoding effectively transformed categorical features for modeling
- PCA reduced dimensions from 66 to 15 while preserving ~80% of variance
- SVM on PCA-reduced data improved accuracy from 87.2% to 94.4% for gender prediction
- Dimensionality reduction not only simplified the model but also enhanced performance
Data Science Workflow
Below is a visual representation of the end-to-end data science workflow implemented in this project:
Implementation Details
The implementation involved several key components:
Data Normalization
# Z-score normalization
bank_data$cont1_z <- scale(bank_data$cont1)

# Min-Max normalization
bank_data$credit.score_minmax <- (bank_data$credit.score - min(bank_data$credit.score, na.rm = TRUE)) /
                                (max(bank_data$credit.score, na.rm = TRUE) - min(bank_data$credit.score, na.rm = TRUE))

# Decimal scaling
magnitude <- 10^ceiling(log10(max(abs(bank_data$cont6), na.rm = TRUE)))
bank_data$cont6_decimal <- bank_data$cont6 / magnitude
Equal-Depth Binning
# Create quantile breaks for equal-depth binning
breaks <- quantile(bank_data$cont1, probs = seq(0, 1, length.out = 4), na.rm = TRUE)

# Create bins using cut function
bank_data$cont1_binned <- cut(bank_data$cont1,
                             breaks = breaks,
                             labels = c("Low", "Medium", "High"),
                             include.lowest = TRUE)
SVM with Cross-Validation
library(e1071)
library(caret)

# Set up 10-fold cross-validation
ctrl <- trainControl(method = "cv", number = 10)

# Train SVM model with cross-validation
svm_model <- train(
  approval ~ .,
  data = bank_data_clean,
  method = "svmLinear",
  trControl = ctrl
)

# Print results
print(svm_model)
print(svm_model$results)
PCA Implementation
# Prepare data for PCA
pca_data <- star_wars_dummy[, !colnames(star_wars_dummy) %in% "gender"]
pca_data_scaled <- scale(pca_data)

# Perform PCA
pca_result <- prcomp(pca_data_scaled)

# Calculate variance explained
var_explained <- pca_result$sdev^2 / sum(pca_result$sdev^2)
cumulative_var <- cumsum(var_explained)

# Select components that explain ~80% of variance
num_components <- which(cumulative_var >= 0.8)[1]

# Create reduced dataset with selected principal components
pca_reduced <- pca_result$x[, 1:num_components]
pca_df <- as.data.frame(pca_reduced)
pca_df$gender <- star_wars_dummy$gender
Results and Visualization
The project produced several key visualizations to interpret the results:
Normalization Comparison
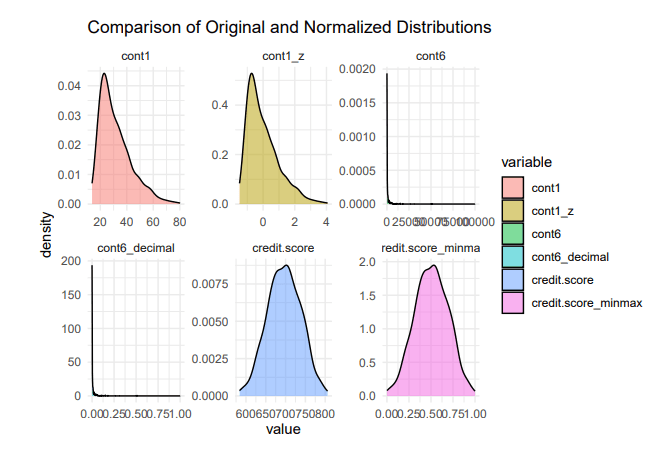
Visualization shows how each normalization technique preserves the shape while rescaling the data
PCA Variance Explained

Visualization demonstrates effective dimensionality reduction while preserving information
SVM Performance Comparison

Visualization shows SVM classification performance metrics
The visualizations clearly demonstrate the benefits of proper data preprocessing and dimensionality reduction. The PCA-reduced model not only simplified the feature space but also significantly improved classification accuracy, highlighting the importance of feature engineering in machine learning workflows.
Challenges & Solutions
Challenge: Handling missing values in the dataset.
Solution: Carefully identified and removed rows with missing values to ensure data quality for modeling.
Challenge: Dealing with high-dimensional feature space after dummy variable creation.
Solution: Applied PCA to reduce dimensions while preserving most of the variance, resulting in a more efficient and effective model.
Challenge: Small sample size for the Star Wars dataset classification task.
Solution: Used 5-fold cross-validation instead of 10-fold to ensure sufficient samples in each fold, providing more reliable performance estimates.
Conclusion & Learnings
This project demonstrates a comprehensive end-to-end data science workflow, from data preprocessing to advanced modeling techniques. The analysis highlights the critical importance of proper data preparation and feature engineering in building effective machine learning models.
Key learnings from this project include:
- Proper data preprocessing (normalization, binning, smoothing) is essential for high-quality analysis
- Cross-validation provides robust performance estimates for model evaluation
- Hyperparameter tuning can significantly improve model performance
- Dimensionality reduction techniques like PCA can both simplify models and enhance their performance
- The balance between model complexity and performance is crucial for building effective predictive systems
These insights and techniques form the foundation of effective data science practice, demonstrating how thoughtful preprocessing and feature engineering can yield substantial improvements in both model performance and interpretability.
Download Full Report
Interested in the complete analysis and code implementation? Download the full report below.
Download PDF Report